Comedian Lewis Black has joked about the end of the universe. It’s already here, he says. “The end of the universe happens to be in the United States—I’ve seen it. And oddly enough, it’s in Houston, Texas.” Black tells a story about leaving the comedy club in Houston and walking down the street to a startling discovery. On one corner was a Starbucks. Across the street from the Starbucks, in an identical building as the Starbucks, was another Starbucks.
“Go there, stand between those two Starbucks, look at your watch. Time stands still.”
“And that, my friends, is the end of the universe.”1
The sheer number of Starbucks in the U.S. is referenced more recently in the “2022 National Census of History Organizations: A Report on the History Community in the United States,” written by Carole Rosenstein and Neville Vakharia and published last year by the American Association for State and Local History (AASLH). The History Census, for short, provides a snapshot and overview of history organizations in the country, and it is “the first national effort to produce an up-to-date, comprehensive, and high-quality data file of history, historic preservation, and history-related organizations and historic sites in the public and non-profit sectors of the United States.”2 Its findings represent data from various sources, including the 2018 Institute of Museum and Library Services (IMLS) Museum Data File, lists of organizations provided by state officials, and the AASLH’s membership.3
I found The History Census refreshing and even a little cathartic to read. It affirms the conditions many local history organizations feel on the ground and that I observe as an archivist and researcher. The Livingston County Historical Society (LCHS) was counted in the History Census. Although it is not mentioned by name in its report, I see it represented in its findings, particularly in what it says about the prevalence of small non-profit organizations in the field. I have always thought that the LCHS represents a typical history organization—small, mostly volunteer-run, focused primarily on local history—but even I was stunned by how much the data in this report confirms this hypothesis.
In addition to analyzing recent data about history organizations, the History Census prompts broader reflection on the many venues in which the past is studied, shared, and discussed. Oddly enough, this occurs when we consider what is not in this report. Focusing only on history organizations does not tell the whole story of history work. Even still, through what it does (and does not) represent, the History Census reminds us that the “who” within the question “Who does history?” is someone much closer to home. This is where I found the deepest connections between the findings of the History Census report and the LCHS. Simply put, there would be no history organizations without communities of people to run them. In the case of LCHS, this means that generations of community members over the past 150 years have cared a lot about local history and the stories preserved by the historical society.
Below are my main takeaways from the 2022 History Census. The charts you see are taken directly from the report and are shared under the Creative Commons Attribution-NonCommerical 4.0 International license (CC BY-NC 4.0).
History buffs (and Lewis Black) will be happy to hear that you are hypothetically more likely to find yourself between two history organizations than two Starbucks. The census counted 21,588 history organizations in the United States. That’s more history organizations than Starbucks cafes, McDonald’s restaurants, and Walmart stores.4 (Does that make anyone else feel really good?) This number includes nonprofit and public sector/government organizations, museums, historical societies, and historical sites. Each organization represented has a mission related to history, has recently filed IRS paperwork (if required), and shows evidence of being engaged in mission-related activity around 2020-2021. The report emphasizes that its count should be considered a floor rather than a ceiling. In other words, the United States has at least 21,588 history organizations.

A few trends emerge when the location of these organizations is considered. Generally, there are more of them where there are more people. The national average of history organizations per state is 423. States with the highest populations—California, New York, Texas, Pennsylvania, and Illinois—all contain over double the national average of history organizations by state.5 On the other hand, states with lower populations—North and South Dakota, Montana, and Vermont—have lower numbers of history organizations.6 Still, the census found that even in lower-population states, there was a comparatively large ratio of history organizations to population, suggesting that history organizations are widespread across the country.7
The History Census’s most substantial conclusions come through its analysis of non-profit history organizations. Here, IRS tax data helps to compose a vivid picture of this subsector’s activities, size, and revenue. About two-thirds of the organizations in its data (14,444 total) operate as private non-profits. Most non-profits in the U.S. are tax-exempt. The IRS classifies the activities of tax-exempt organizations using the National Taxonomy of Exempt Entities (NTEE), developed by the National Center for Charitable Statistics in the 1980s and instituted by the IRS in the mid-1990s.8 Most history organizations are coded in the “A” subgroup, as in “A” for “Arts, Culture, and Humanities.” NTEE designations for organizations in the History Census show that most non-profit history organizations (66%) are classified as “A82–Historical Societies & Historical Preservation,” followed next by “A54–History Museums” (24%). As the report notes, this distinction is “blurry” because many historical societies also run museums and maintain historical collections. The LCHS is an example of this: it is an A82 organization but runs the Livingston County Museum as one of its main programs.9
I took a closer look at the definitions for NTEE designations to see how this taxonomy defines and differentiates these two categories. They read as follows:
A54-History Museums: Organizations that acquire, preserve, research and exhibit collections of objects including documents, tools, implements and furnishings that have significance in helping to interpret or understand the past. History museums may specialize in a specific era such as early Greece or Rome, a particular geographical region such as California or Appalachia, a particular ethnic or cultural group such as Native Americans or a specific subject area such as costumes; and may contain items created or used by contemporary or historical figures.
A82-Historical Societies & Historical Preservation: Organizations that interpret, collect and preserve the historical heritage of a specific geographic location.10
I have three thoughts based on these definitions:
- Both definitions overlap by discussing similar activities, suggesting that the NTEE was not created to be a strict classification with mutually exclusive groupings. NTEE designations may not be the best way for the history field to understand the activities occurring at any given organization.
- Interestingly, the historical scope seems to be the differing feature between these two categories, with “A82–Historical Societies & Historical Preservation” organizations defined as possessing a singularly local history focus (i.e., history of a bound geographic area).
- This relatively brief analysis of NTEE classification begs for a festive Tax Day holiday edition of The Historical Society Project. I want to know more…
Most importantly, though, tax data reveals that most nonprofit historical organizations in the United States are small to very, very small in revenue and staff. As the report discusses, there is no standard measurement for the sizes of non-profit organizations. However, it uses the following scale to distinguish between the revenues of non-profits:
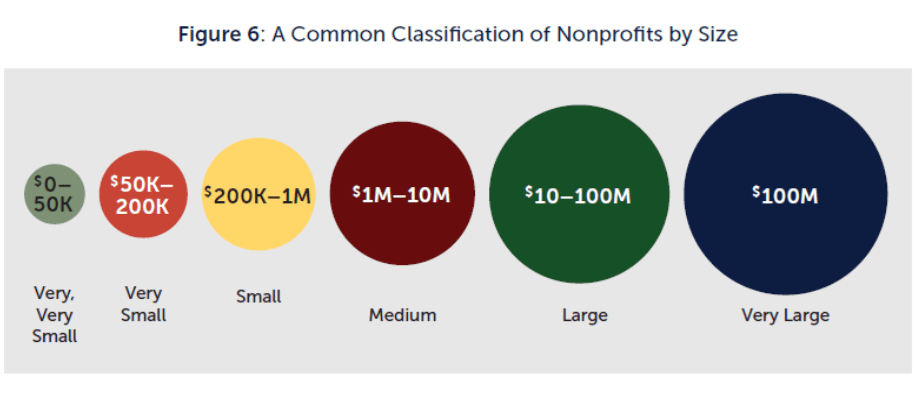
Don’t let the size of the circles fool you. Most organizations occupy the left half of this scale with the smaller circles, as the table below indicates:
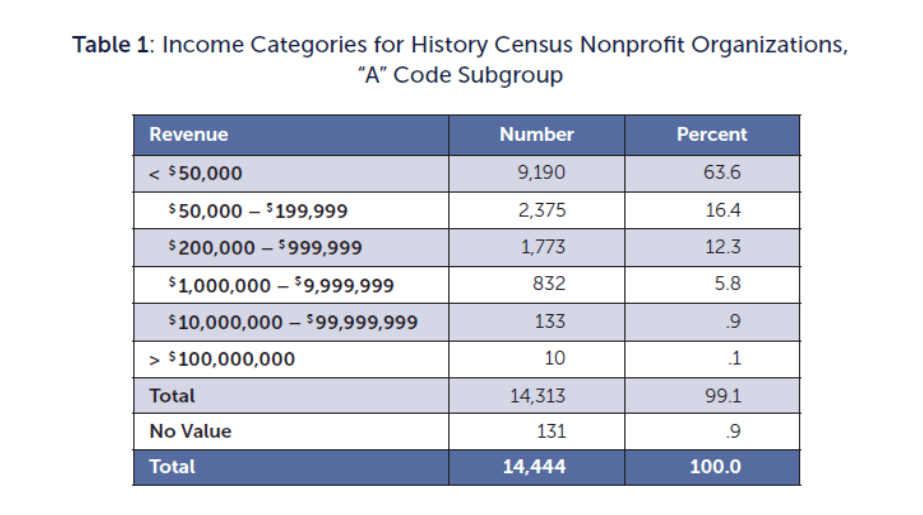
For context, according to the History Census, the revenue distribution among history organizations, as seen in the above chart, is consistent with the broader nonprofit sector, where more than half of nonprofits are very, very small, with revenues of less than $50,000 annually.11
In regard to the LCHS, from 2018 to 2021, it was consistently in the “very small” category, according to publicly available 990 tax forms on websites like ProPublica and GuideStar.12
Revenue size directly correlates to staff size and capacity. As the report explains, “an assumption in nonprofit sector studies is that at around the $200,000 revenue threshold, nonprofit organizations will tend to have a full-time, professional staff member running an operation.” When we apply this estimated threshold to the previous data showing that about 80% of history organizations make less than $200,000 in revenue, we can extrapolate that only about a fifth of nonprofit history organizations are run by a full-time professional staff person. Put another way, almost all the nonprofit subsector’s full-time workforce is employed by only 20% of nonprofit history organizations.13
For very small history organizations, like the LCHS, the History Census estimates that these organizations are likely engaged in regular programming but probably not run by a full-time staff member (the report does not infer if very small organizations might have paid part-time staff). The LCHS, however, reports on recent tax returns to have one full-time staff member.14 The LCHS example contradicts the History Census’s estimates for the relationship between revenue size and staffing, suggesting that one should consider the $200,000 revenue threshold for employing a full-time staff member as a very soft benchmark.
I had a saga of emotions after reading the History Census’s analysis of nonprofit history organizations. At first, I was disheartened because the History Census paints a very precarious landscape with so many small organizations that could, theoretically, come in and out of existence due to a lack of funds. Perhaps even more distressing to me as a professional archivist was the notion that most of the professional expertise of the field is concentrated in a relatively small portion of it. Only a fraction of the people involved with historical organizations are likely to help generate standards and best practices, drive innovation in new technologies, and attend professional conferences to exchange ideas and build camaraderie with peers. On the flip side, this means that the people who are paid (me included) don’t hear from most people doing history work. This dynamic makes me question the effectiveness of our professional organizations and communities of practice to represent and uplift the work of smaller, volunteer-based organizations. The History Census also echoes this concern in its recommendations, calling for more tailored support from the AASLH and other professional organizations for smaller history organizations.15
This doom and gloom feeling subsided once I ruminated more about the larger context of the History Census. The nonprofit statistics that had me worked up were just that—for the nonprofit sector. The public sector, which includes government entities, makes up a third of the organizations in the History Census and is likely better funded and staffed than most nonprofit organizations. However, the public sector faces budget constraints and cuts as well. Additionally, the report says nothing about the handful of corporate history organizations that operate within the field, such as History Associates Incorporated, Heritage Werks, and the Winthrop Group. These organizations primarily consult with businesses to write institutional history and preserve company records.
Moreover, history organizations make up only a part of the total history work in the United States. For example, the History Census does not include colleges and universities with departments in History, Anthropology, Library Science, Museum Studies, and many other disciplines. In addition to advancing scholarship, colleges and universities play a huge role in promoting and supporting public history in their communities through the direct involvement of their faculty or by encouraging students to participate. I feel lucky to be an alum of two universities (SUNY Geneseo and Queens College-CUNY) with professors who actively do local history work in New York State and provide the kind of tailored support to small history organizations that the History Census recommends. SUNY Geneseo, in particular, factors heavily in the past and present of the LCHS, and I look forward to discussing this relationship in future posts.
To their credit, the History Census researchers acknowledge the limitations of their scope. For example, the History Census does not count organizations that do history or historical preservation as a secondary project to their primary mission. This is a significant omission because it may have caused an underrepresentation of historical work done in marginalized and under-resourced communities, as organizations in these communities are often interdisciplinary and, by necessity, fulfill many needs for their communities. Among the examples provided in the History Census are organizations related to cemeteries and burials, cited as particularly important in the African American community. Many support burials as their primary program but also engage in crucial historic preservation activities.16 The History Census recommends more study of history organizations in historically marginalized communities to understand their needs better and boost their representation in future sector-wide studies.17
The History Census also does not represent history that is done in more casual, interpersonal ways. As the report notes, “looking at the formal, incorporated dimension of the history subsector in some ways serves only to show how much history and preservation activity goes on outside of it: in families, through social media, in friend and enthusiast groups, and the everyday life of a community.”18 I circled this quote and wrote a big exclamation point next to it. In a report all about the prevalence and characteristics of history organizations in the United States, this sentence highlighted their relative insignificance compared to the multitude of informal and intimate ways people participate in history.
Ultimately, I think these casual forms of history work help explain why there are so many small, volunteer-dependent history organizations in the United States. History organizations stand on an enduring bedrock of personal and local history participation, ranging from family genealogy research at a local library to conversations between friends about the good old days over a cup of joe at Starbucks. Local history will be there at the end of the universe—of this, I am sure.
Through this research, I want to understand what inspires someone to come to the history (coffee) table. What motivates participation in history, particularly in more formally incorporated ones, such as a local historical society? The History Census suggests a prevailing belief that history has an essential public purpose and should serve the public good.19 Put in less flowery terms, this usually means that history should educate, inform, and be accessible to everyone. When I talk to people around the LCHS today or look at the writings and actions of those involved in the LCHS in the past, I see this general “public good” sentiment echoed as well. However, more varied responses emerge when I dig deeper and ask (or consider through primary sources), “Why are you here? Why is local history and the historical society important to you and the community you live in?” The answers I receive dovetail with political beliefs, career and educational background, religious affiliations, social status, family background, friend networks, hobbies, and many more personal factors. Some are there because their family has roots in Livingston County, and contributing their time to the LCHS is one way to feel closer to their ancestors. Others are former educators deeply passionate about the historical society’s educational mission. Some participate because they believe history can help solve societal problems or stave off cultural disasters. In contrast, others are there because history is fun. All these ideas and motivations collide in the past and present work of the LCHS and the over 21,587 other history organizations around the United States.
Cover image: Created by Regina Carra, featuring Starbucks photo by G. Edward Johnson (CC BY 4.0), Lewis Black photo by Chad J. McNeeley (edited), and cover of The History Census (CC BY-NC 4.0).
- Lewis Black, “The End of the Universe,” track 6 on End of the Universe, Stand Up! Records, 2002, YouTube video, 2:23, accessed September 18, 2023, https://www.youtube.com/watch?v=Mb7qDfIzQRk ↩︎
- Carole Rosenstein and Neville Vakharia, “2022 National Census of History Organizations: A Report on the History Community in the United States” (Nashville, TN: American Association for State and Local History, June 2022), 5. ↩︎
- The report provides a full list of sources as well as a lengthy explanation of how the researchers compiled their final data file. Rosenstein and Vakharia, 25. ↩︎
- This is effective marketing, but not a new comparison. The number of Starbucks and McDonald’s were compared to the number of museums counted in the IMLS’s Museum Count Survey, conducted throughout the late 2000s and early 2010s. This comparison became the headline of a Washington Post article and has been cited in AASLH publications. Emily Badger, “Every Library and Museum in America Mapped,” Institute of Museum and Library Services blog, June 2023, https://www.imls.gov/blog/2013/06/every-library-and-museum-america-mapped; Christopher Ingraham, “There are more museums in the U.S. than there are Starbucks and McDonald’s combined,” Washington Post, June 13, 2014, https://www.washingtonpost.com/news/wonk/wp/2014/06/13/there-are-more-museums-in-the-us-than-there-are-starbucks-and-mcdonalds-combined/; Carol Kammen, “Foreword to the Second Edition,” in Defining Memory: Local Museums and the Construction of History in America’s Changing Communities, second edition, ed. Amy K. Levin and Joshua G. Adair (Lanham, MD: Rowman & Littlefield, 2017), xvi. ↩︎
- Florida is noted in this report as an outlier. Despite Florida being the third most populous state, the census counted only 596 organizations, still well above the national average but low compared to other populous states. Rosenstein and Vakharia, 8. ↩︎
- The report notes that some of the states (including North Dakota) represented in the data file as having the lowest number of history organizations did not respond to some or all the outreach requests from the researchers, which may contribute to an underrepresentation of these states in the data file. Rosenstein and Vakharia, 30. ↩︎
- Rosenstein and Vakharia, 8. ↩︎
- Deondre’ Jones, “National Taxonomy of Exempt Entities (NTEE) Codes,” National Center for Charitable Statistics, Urban Institute, April 2, 2019, accessed September 18, 2023, https://nccs.urban.org/project/national-taxonomy-exempt-entities-ntee-codes. ↩︎
- “Livingston County Historical Society,” GuideStar, accessed September 18, 2023, https://www.guidestar.org/profile/16-6049755. ↩︎
- Deondre’ Jones, “IRS Activity Codes, National Taxonomy of Exempt Entities (NTEE) Codes,” National Center for Charitable Statistics, Urban Institute, January 22, 2019, accessed September 18, 2023, https://nccs.urban.org/publication/irs-activity-codes. ↩︎
- Rosenstein and Vakharia, 17. ↩︎
- Internal Revenue Service, Form 990EZ, Livingston County Historical Society, 2018, 2019, 2020, accessed September 17, 2023, GuideStar, https://www.guidestar.org/profile/16-6049755; Internal Revenue Service, Form 990EZ, Livingston County Historical Society, 2021, accessed September 17, 2023, ProPublica Nonprofit Explorer, https://projects.propublica.org/nonprofits/organizations/166049755. ↩︎
- Rosenstein and Vakharia, 18. ↩︎
- Internal Revenue Service, Form 990EZ, Livingston County Historical Society, 2021. ↩︎
- Rosenstein and Vakharia, 21-22. ↩︎
- Rosenstein and Vakharia, 21. ↩︎
- Rosenstein and Vakharia, 23. ↩︎
- Rosenstein and Vakharia, 20. ↩︎
- Rosenstein and Vakharia, 20. ↩︎

Leave a comment